SCOM

Configuring Global Service Monitor for SCOM

As System Center people, we all know that SCOM is very powerful and capable at monitoring but unless you deploy Management Servers or Gateway Servers into a public cloud environment like Azure, all of your monitoring comes with the perspective of inside your environment. If you are hosting web services that are externally accessible, one important aspect to consider is outside-in monitoring, otherwise known as monitoring your externally facing services from outside of your organisation.

Licensing and Registering

Global Service Monitor (GSM) for SCOM has been around for quite some time now since 2013 and I still see people running SCOM who are entitled to GSM not using it. To be eligible for GSM, you most importantly need to be running System Center Operations Manager 2012 SP1 or higher. You need to have a properly licensed SCOM deployment and you need to have Software Assurance for your System Center licenses as GSM is an SA benefit if you want to use the service permanently or you can also sign up for a free 90 day trial of GSM if you don’t have SA on your licenses to try the service out as I did.

To activate your SA benefit for GSM or to register for a 90 day trial, you first need to visit the Microsoft Commerce Portal at http://go.microsoft.com/fwlink/?LinkId=275502. You need an Organisational Account to sign in here which means in a sly way, you need to be using Office 365, Azure or Intune as well or at least have a working Azure Active Directory deployment ready for you to consume one of these services in the future.

Preparing the Management Servers

Once you get yourself either signed up or activated according to whether you are going trial or permanent, we need to download the GSM Management Pack. You can obtain this from the Microsoft Download Center at http://www.microsoft.com/en-us/download/details.aspx?id=36422. The download is a .msi file which you need to install to extract the Management Pack Bundle files.

With the files extracted but before we can install the Management Packs, you need to check you have the relevant Windows Features installed. GSM requires the Windows Identity Foundation 3.5 feature to be enabled on the Management Servers which will participate in the monitoring so make sure you install this on all the relevant Management Servers and not just the once you perform the installation on.

To avoid posting a screenshot of clicking through Server Manager and Add Roles and Features Wizards, the PowerShell Cmdlets for installing this feature is below.

Import-Module ServerManager
Install-WindowsFeature Windows-Identity-Foundation

Once that is out of the way, you can import the Management Packs into SCOM.

Import GSM Management Packs

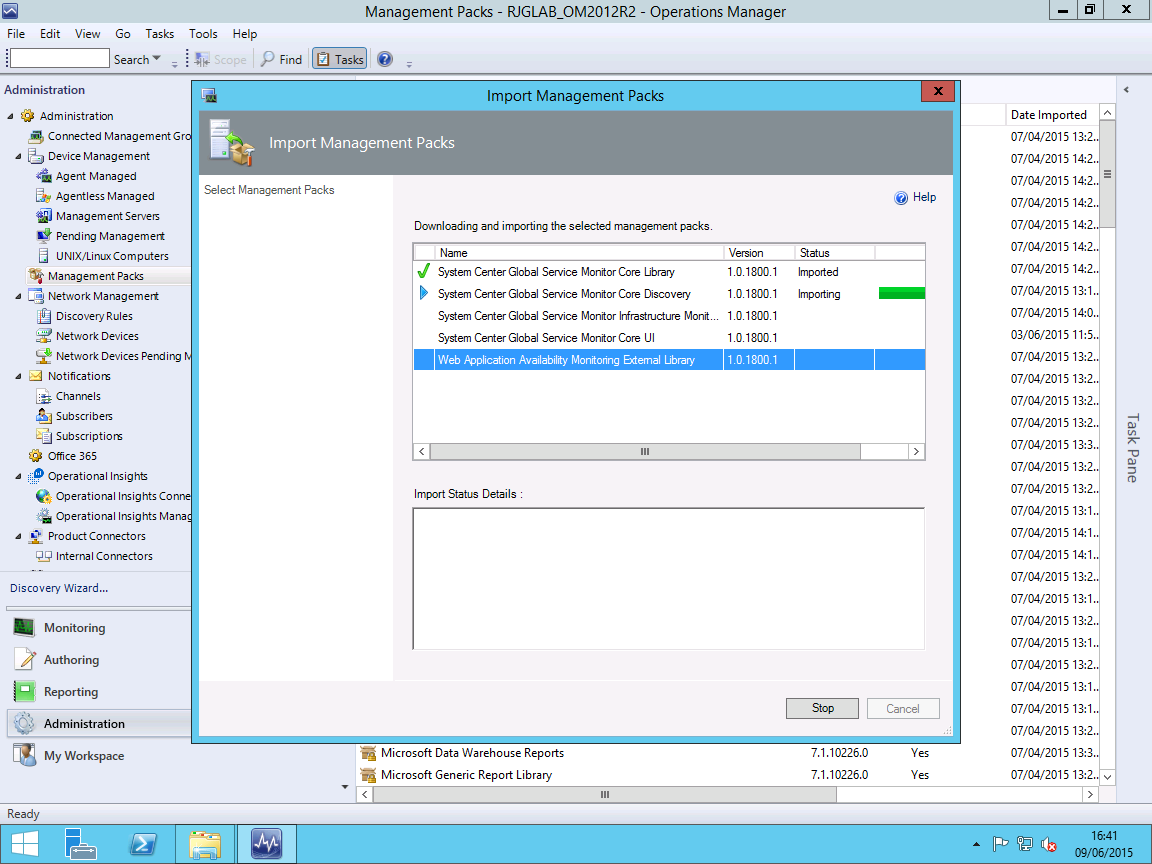
Configuring Global Service Monitor Settings

Once you have the Management Packs imported, a new view will be added to the Administration pane of the Operations Manager console for Global Service Monitor and you can start the configuration wizard. You will be asked to sign-in using your Organisational Account as part of the process and from this, your GSM Subscription ID will be discovered.

Configure GSM Resource Pool

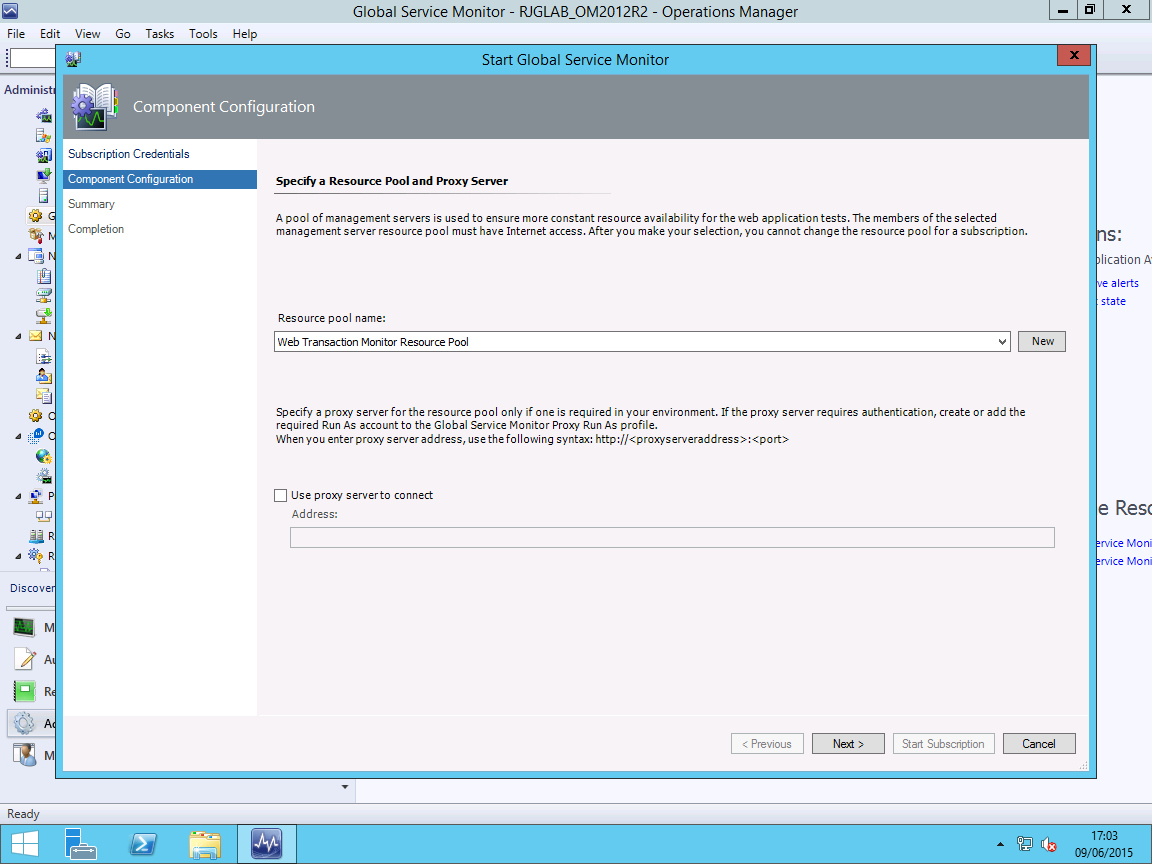
GSM uses Resource Pools for determining which Management Servers will communicate with the service. You can use the All Management Servers Resource Pool however this is not recommended. I have created a new resource pool for as recommended. You also here have the option to configure a proxy server to use to access the GSM service.

Creating Web Application Availability Monitors

Once you have completed the wizard above and GSM is configured, you can start to configure monitors using the service. I already had an existing Web Application Availability Monitor configured for my blog so I have modified this to use GSM. It is important to note that GSM only works with Web Application Availability Monitors and not with Web Application Transaction Monitors so you will need to make sure that you are using the appropriate type. There is a good article on System Center Central that compares the two types of monitor and what each can do at http://www.systemcentercentral.com/which-is-the-best-synthetic-web-transaction-to-use-in-operations-manager-for-my-requirements-scom-sysctr/ if you need to understand the difference.

Web Application Availability Monitor Locations

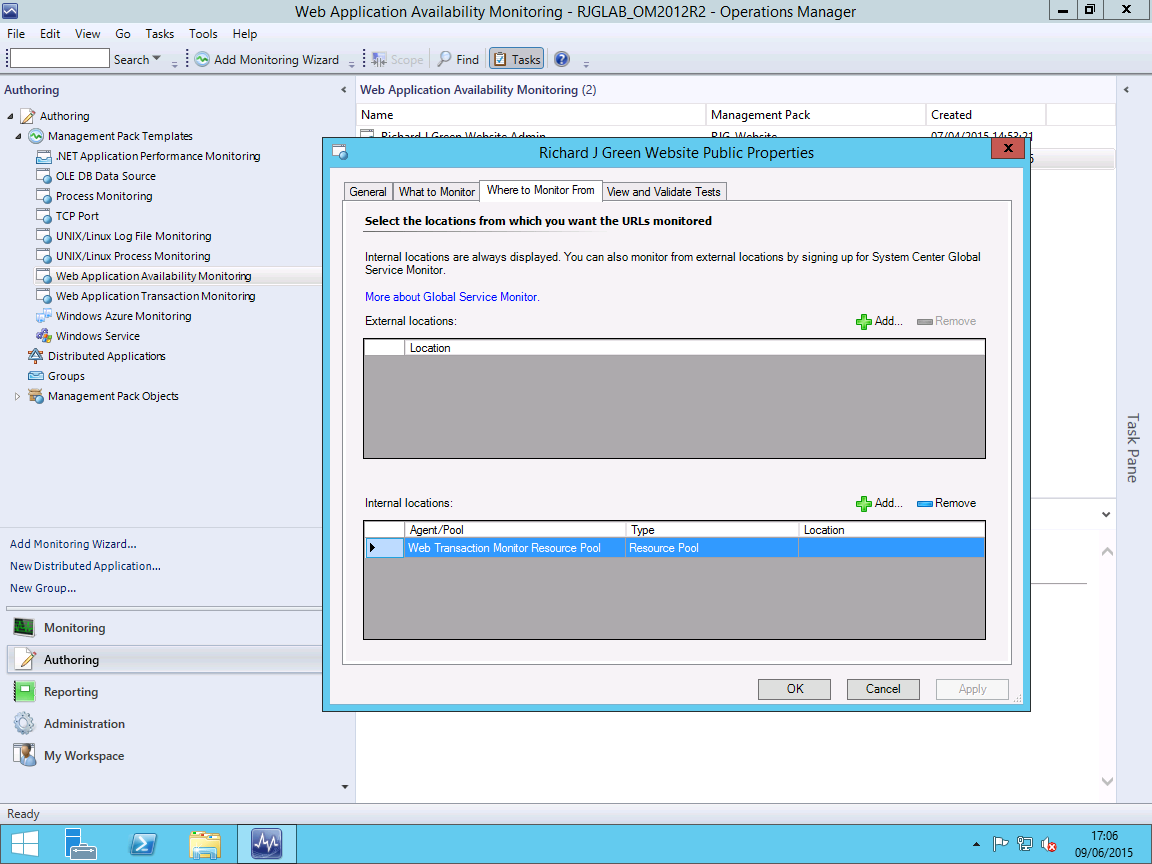
As you can see above, I have my existing Web Application Availability Monitor and I have one internal location configured, my resource pool however we have an empty field above called External Locations. Select the Add button to add a new external location.

Web Application Availability Monitor Set External Locations

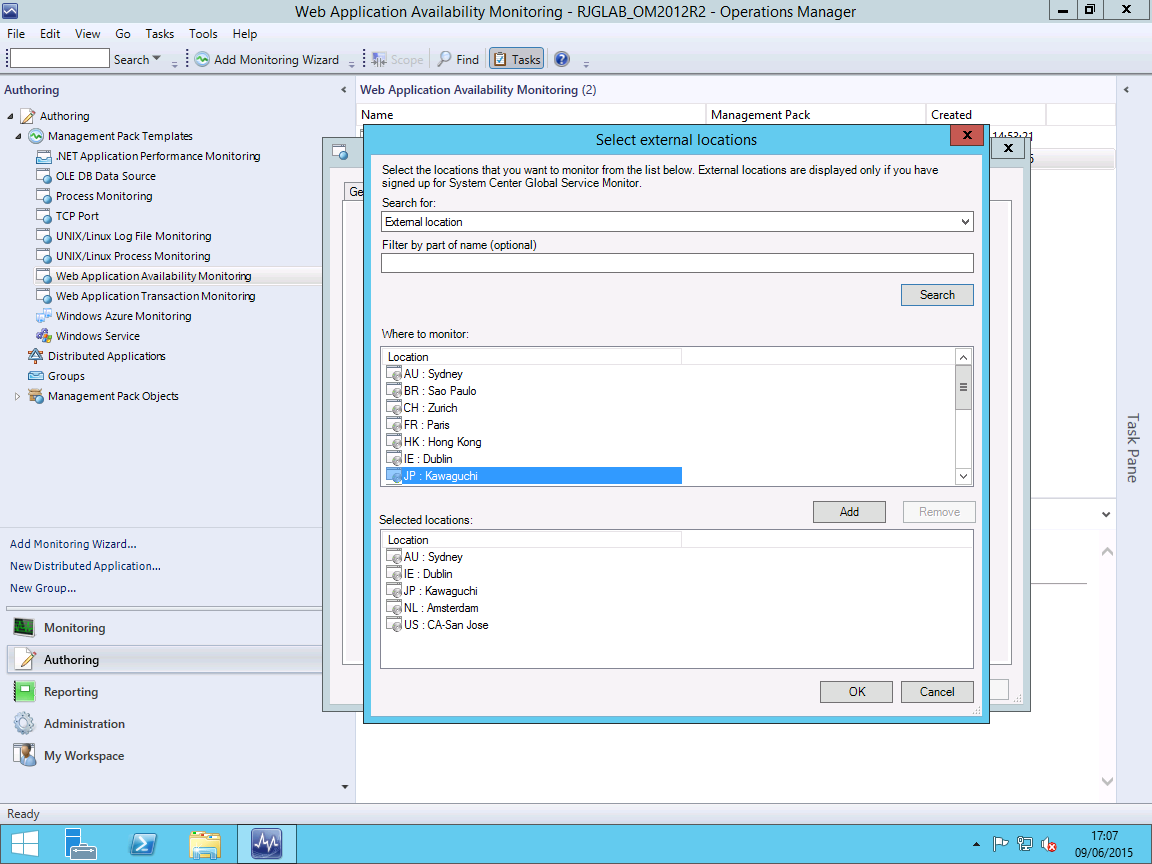
Selecting this option now presents us with a list of the available GSM monitoring locations. Those familiar with the Azure datacentre locations will note that they are the same as the GSM locations. I selected a few choice locations but which ones you use or how many is entirely up to you. If your service that you are trying to outside-in monitor is truly global, you may want to use them all but if you are only interested in the availability of your service within a particular geographic region then just use those relevant to you.

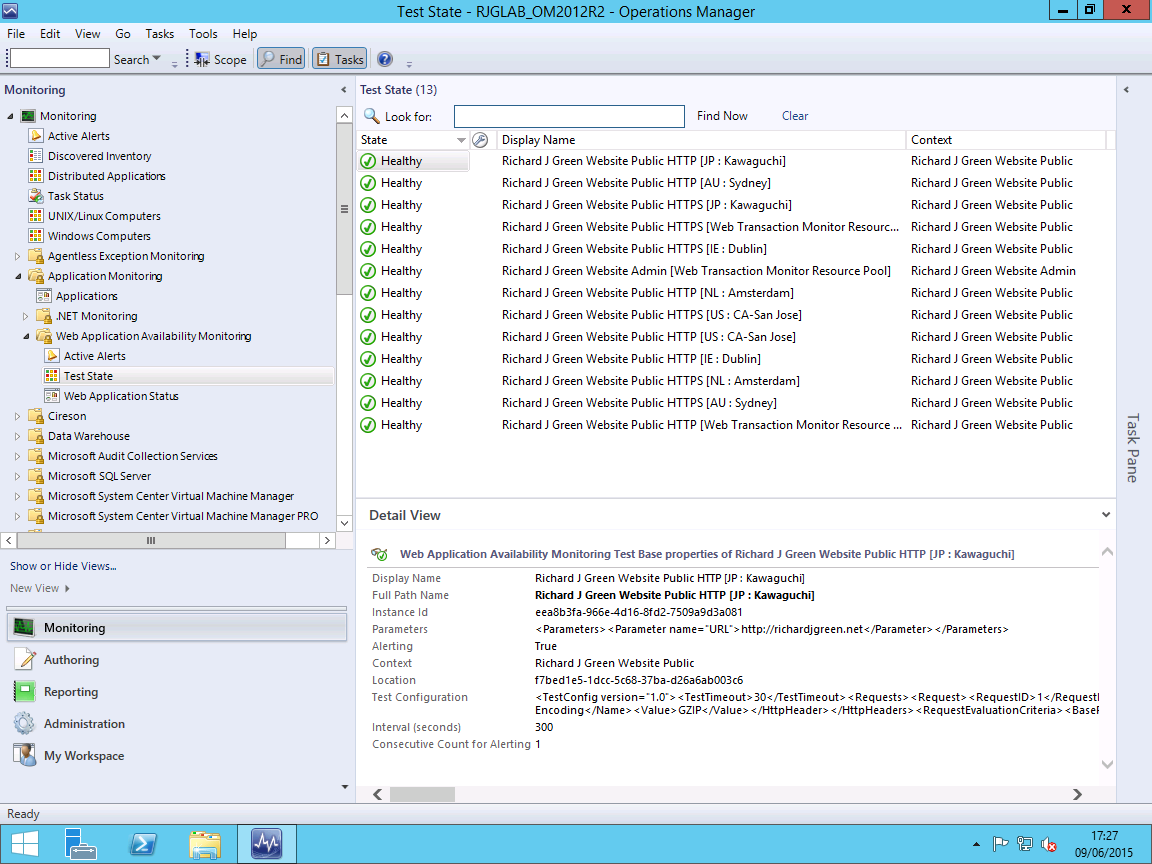
Once you apply the changes it takes a little while for the request to be sent up to Global Service Monitor and for the monitoring data to start coming back down but after a short wait, about fifteen minutes in my case, I started to see the health state for the various monitoring sites in the Monitoring view.

Web Application Availability Monitor Health

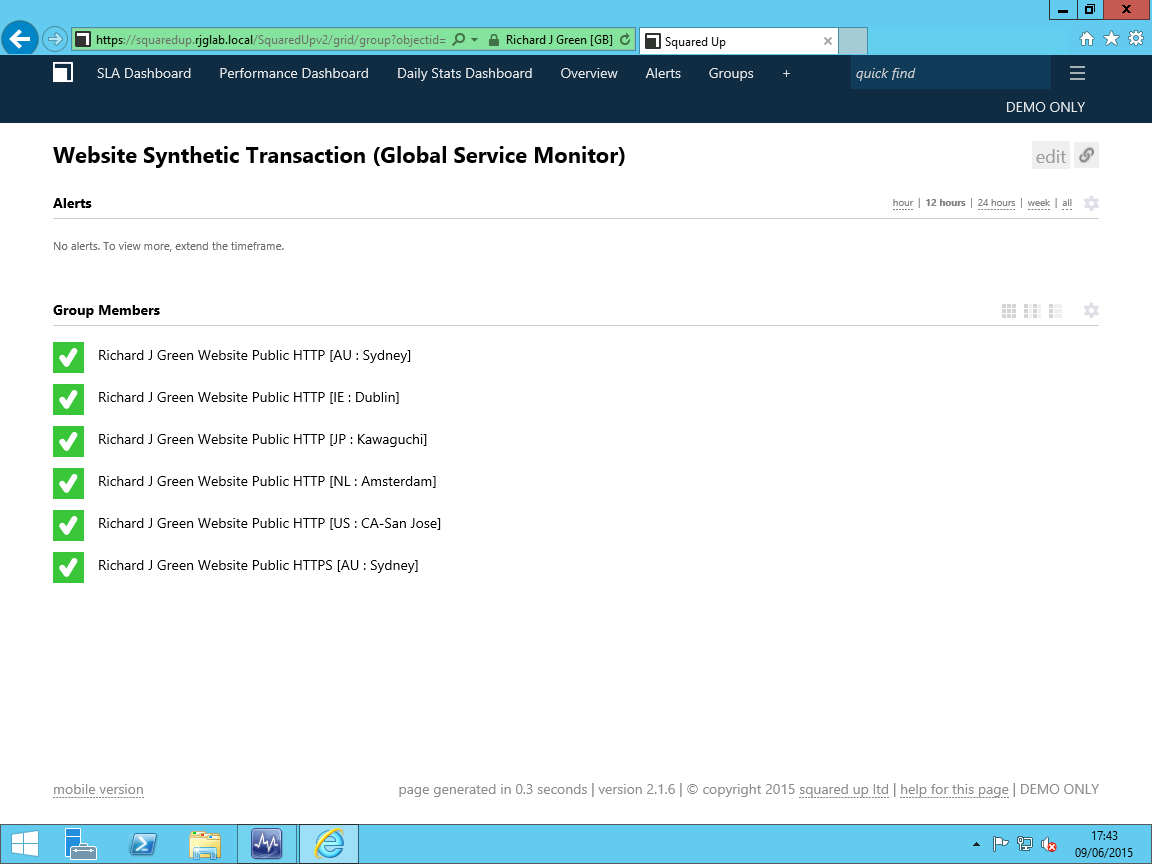
In my lab, I am using SquaredUp to provide rich HTML5 visualizations of my SCOM environment so I decided to take this a step further and I am using the Azure SQL Database Management Pack to monitor my Azure SQL databases that host my WordPress database and I built a Distributed Application for it and presented it via SquaredUp as shown below.

Web Application Distributed Application  Web Application Monitor via SquaredUp

And there we have it, a setup and working outside-in monitoring solution for web services using SCOM and taking advantage of SA licensing benefits. One of the best things about this is that each monitored location retrieves the counters you specify whilst configuring your Web Application Availability Monitor so you get the response time, DNS resolution time and other counters for each region so you can see really clearly how latency plays a part in your applications performance.

I hope you found this useful and it helps you to monitor your own solutions with GSM.


Office 365 Management Pack for SCOM

Yesterday I got a chance to play with the Office 365 Management Pack for SCOM. Usual rules apply, read the release notes, import the Management Pack and then configure it, the same rules for all Management Packs you import into SCOM.

The installation was simple by downloading the .msi file from the Microsoft Download page at http://www.microsoft.com/en-us/download/details.aspx?id=43708 however in that this is a Microsoft Management Pack for a Microsoft product, I would have expected this to be published to the Management Pack Catalog in SCOM not a separate .msi file download as it would have certainly streamlined the installation process a little.

Once installed, the configuration of the Management Pack is really simple as an Office 365 configuration link is added to the Administration view. It gets added to the very bottom of the list so if you think you don’t have it visible, make sure you’ve scrolled all the way to the bottom. From the configuration wizard, you simply feed it a friendly name for your tenant and give it the email address for a user in Office 365 or configured through your Azure Active Directory.

The reason for this post, other than to explain how simple the Management Pack is to deploy is to have a little gripe. The user which you create in Office 365 needs to be configured as a Global Administrator on your tenant. To compare things to on-premises, that’s like using an account which is a member of Enterprise Admins to monitor Exchange On-Premises, a bit of a sledgehammer to crack a nut. I personally like things to be least privileged so the idea of having a Global Administrator account for this purpose is an annoyance. In that the Management Pack is testing the health of services within your tenant, I personally don’t see any reason that this account couldn’t be a Service Administrator to still give it some administrative powers but lessen them or failing that, a standard user. I suspect the need for being an administrator comes from the need to query a service API which is only available to accounts authenticated with administrative rights.

The upside of course to my gripe about the account being a Global Administrator however is that you do not need to assign any Office 365 service licenses to the account so it means you don’t need to shell out £20 a month for your E3 license per user in order to be able to monitor Office 365 from SCOM.

Monitoring SQL Server Agent Jobs with SCOM Guide

Late last night, I published a TechNet Guide that I have been working on recently entitled “Monitoring SQL Server Agent Jobs with SCOM”. Here’s the introduction from the document.

All good database administrators (DBAs) create jobs, plans and tasks to keep their SQL servers in tip top shape but a lot of the time, insight as to the status of these jobs is left either unturned like an age old stone or is done by configuring SQL Database Mail on your SQL servers so that email alerts are generated which means you have additional configuration being done on every server to configure this and it’s yet another thing to manage.

In this guide, I am going to walk you through configuring a System Center Operations Manager 2012 R2 environment to extend the monitoring of your SQL Servers to include the health state of your SQL Server Agent Jobs, allowing you to keep an eye on not just the SQL Server platform but also on the jobs that run to make the platform healthy.

You can download the guide from the TechNet Gallery at https://gallery.technet.microsoft.com/SQL-Server-Agent-Jobs-with-f2b7d5ce. Please rate the guide to let me know whether you liked it or not using the star system on TechNet. I welcome your feedback in the Q&A.

SCOM Hyper-V Management Pack Extensions

If you’ve ever been responsible for the management or monitoring of a Hyper-V virtualization platform, you’ve no doubt wanted and needed to monitor it for performance and capacity. The go to choice for monitoring Hyper-V is System Center Operations Manager (SCOM) and if you are using Virtual Machine Manager (VMM) to manage your Hyper-V environment then you could have and should have configured the PRO Tips integration between SCOM and VMM.

With all of this said, both the default SCOM Hyper-V Management Pack and the monitoring improvements that come with the VMM Management Packs and integration are still pretty lacklustre and don’t give you all the information and intelligence you would really like to have.

Luckily for us all, Codeplex comes to the rescue with the Hyper-V Management Pack Extensions. Available for SCOM 2012 and 2012 R2, the Management Pack provides the following (taken from the Codeplex project page):

New features on release 1.0.1.282
Support for Windows Server 2012 R2 hyper-V
Hyper-V Extended Replica Monitoring and Dashboard
Minor code optimizations

Features on release 1.0.1.206
VMs Integration Services Version monitor
Hyper-V Replica Health Monitoring Dashboard and States
SMB Shares I/O latency monitor
VMs Snapshots monitoring
Management Pack Performance improvements

Included features from previous release
Hyper-V Hypervisor Logical processor monitoring
Hyper-V Hypervisor Virtual processor monitoring
Hyper-V Dynamic Memory monitoring
Hyper-V Virtual Networks monitoring
NUMA remote pages monitoring
SLAT enabled processor detection
Hyper-V VHDs monitoring
Physical and Logical Disk monitoring
Host Available Memory monitoring
Stopped and Failed VMs monitoring
Failed Live Migrations monitoring

The requirements to get the Management Pack installed are low which makes implementation really easy. If you keep your core packs updated there is good chance you’ve already got the three required packs installed, Windows OS 6.0.7061.0, Windows Server Hyper-V 6.2.6641.0 and Windows Server Cluster 6.0.7063.0.

The project suggests there is documentation but it seems to be absent so what you will want to know is what is the behaviour going to be upon installation? If you have a development Management Group for SCOM then install it here first to test and verify as you should always be doing. The Management Pack is largely disabled by default which is ideal but there are a couple of rules enabled by default to watch out for so check the rules and change the default state for the two enabled rules to disabled if you desire.

As is the norm with disabled rules in SCOM, create a group which either explicitly or dynamically targets your Hyper-V hosts and override the rules for the group to enable them. The rules are broken down into Windows Server 2012 and Windows Server 2012 R2 sets so you can opt to enable one, the other or both according to the OS version you are using for your Hyper-V deployments.

If you do have the VMM integration with SCOM configured and you are using Hyper-V Dynamic Memory, you will notice very quickly if you enable all the rules in the  Hyper-V Management Pack Extensions that you will start receiving duplicate alerts for memory pressure so make a decision where you want to get your memory pressure alerts from be it the VMM Management Pack or the Hyper-V Extensions Management Pack and override and disable alert generation for the one you don’t want.

There is still one metric missing even from this very thorough Hyper-V Extensions Management Pack and that is the collection of the CPU Wait Time Per Dispatch performance counter, the Hyper-V equivalent of the VMware vSphere CPU Ready counter. I’ll cover this one in a later post with a custom Performance Collection Rule.

You can download the Management Pack from Codeplex at http://hypervmpe2012.codeplex.com/. I hope it finds you well and enjoy your newly found Hyper-V monitoring intelligence.

Configuring the Windows Azure Alerts Preview Feature

As part of the project I’ve been working on for the last six months to deliver a new public website (hint www.primark.com) using Windows Azure we needed to be able to monitor the site performance and alert on warning and critical thresholds for certain counters. At the start of the project, our intention was to use SCOM (System Center Operations Manager) as the cleanest way to get data out of Windows Azure but by the time we went live two weeks’ ago, Microsoft had made available the Windows Azure Alerts feature preview.

Under normal circumstances, SCOM would’ve been a no brainer decision for us as our operational teams use and rely on SCOM already so they are familiar and comfortable using it however with the website, we had a challenge – the third-party.

Setting up SCOM 2007 R2 to monitor Windows Azure sounds really complicated when you read the TechNet article for it at http://technet.microsoft.com/en-us/library/gg276377.aspx however it’s actually pretty simple, something which I’ll cover in a later post on the subject, however as I mentioned, our project involved a third-party development partner who needed to receive the alerts also once we went live. In SCOM, you configure this using an SMTP Subscription to email the alerts raised by the management pack to those who need it, but this would result in our Exchange platform joining the critical path for the monitoring of the website, something which I didn’t want ideally as the architect for the project. Imagine the conversation explaining how you missed a website outage or performance degradation because Exchange was down 😮

Fortunately for me, Microsoft came up trumps with the Windows Azure Alerts preview feature just weeks before I was about to go live with the SCOM management pack configuration for production although I had already configured it for our staging environment by this point.

Windows Azure Alerts allows you to configure SCOM like thresholds and evaluation periods for usage counters and metrics from your Azure services and in turn, generate email alerts for them. This has allowed me to remove Exchange from our critical path for website monitoring because the email alerts are generated directly at source in Windows Azure.

To get started with Windows Azure Alerts, firstly, open your Cloud Service, Web Site, SQL Azure Database or whatever you’d like to monitor in the Windows Azure Management Portal. Once open, select the Monitor tab from the Windows Azure Dashboard.

Azure Cloud Service Monitor

Once you’re on the Monitor tab, select the monitor that you would like to generate alerts for. If the monitor you want to use is not listed then you need to update, amend or possibly even start the configuration of diagnostics. Look at the MSDN page, Collect Logging Data by Using Windows Azure Diagnostics to get started.

Azure Cloud Service Add Rule

With the monitor highlighted, the contextual bottom navigation now shows an option Add Rule. Click this to open the rule definition wizard.

Azure Alert Define Rule

In this rule, I’m configuring monitoring for high CPU utilization on a Cloud Service. Give the rule a name and a description. These are included in the email alert you are sent in the event that the rule is triggered so make sure that it’s something you or people receiving the alert can relate to. Once entered, click the arrow to go to page two.

Azure Alert Define Conditions

On page two as shown above, you configure the conditions for the rule. In the case of CPU usage, I’m going to monitor on CPU usage over 80%. Rules are evaluated over a time period before they breach. This is ideal for CPU and memory counters as it means that you won’t be alerted for momentary peaks in demand due to activity occurring in the service but will be alerted for sustained period of high draw. Here, I am setting the evaluation period to the default option of five minutes.

Under the sub-heading Actions, you define whether a single email address (which could be a distribution list) or all of your Azure administrators and co-administrators receive the email alert from the rule. As we have a number of people such as project deployment engineers and developers accessing Azure and the only people who need to receive the alerts are the operational teams, I elected to enter an email address for a distribution list and not all of the subscription administrators and co-administrators.

The last option is the tick box to enable the rule which is checked by default. Click the success tick button to complete the two step wizard and the rule will be created.

Azure Management Services View Alerts

Switching context to the Management Services pane in Azure allows you to see a list of all of the alerts configured for the subscription be they for Web Sites, Cloud Services, SQL Azure Databases or more. Here, I only have one configured but in our production subscription we currently have 10.

There is currently an imposed limit of 10 alert rules per subscription while the feature is in preview. I’ve been meaning to call Microsoft Azure PSS (Premier Support Services) for a week now to see if we can get this limit raised as we would like to create a few additional rules but I haven’t got round to it yet. If I manage to do this, I’ll be sure to let you all know.

So there you have it. How to create email alerts for performance thresholds as you would do with SCOM, directly in Windows Azure removing the need to configure an extra management pack in your SCOM environment and removing critical path dependencies from your internal systems to receive alerts for Windows Azure services. I’m looking forward to this feature coming out of preview and into production service hopefully with a few extra bells and whistles.

Configuring IIS Redirects for HTTPS with the SCOM 2007 R2 Web Console

Whilst working with the SCOM 2007 R2 Console today, I saw that on our SCOM RMS server, the Default Web Site in IIS was running still and occupying Port 80 for no good reason, while the SCOM Console was relegated to Port 51908 which isn’t very user friendly. Additionally, the site was in the clear with no SSL, so I wanted to make the site secure.

Step 1 was to disable the Default Web Site and stop it from starting automatically. Once this is done, remove the Binding for Port 80 from the site to make that port available for use. Once you have done this, you can follow the steps per my previous post Redirecting Non-HTTPS Traffic to HTTPS for SharePoint 2007. Although the post in entitled for SharePoint 2007, it applies to any server running Windows Server 2008 or 2008 R2 with IIS 7 or 7.5, just you need to rename the websites that you create accordingly.

Once complete, users will be able to type the server name which hosts your SCOM Web Console, without needing to append the default port number, and they will be automatically redirected to Port 443 for the HTTPS version of the site, instead of an IIS error stating that they need to use the HTTPS version.

System Center Operations Manager 2007 R2 Web Console Authentication

Whilst working on something un-related today, i discovered a problem with our SCOM 2007 R2 Web Console at work – When I tried to connect to the site, I was prompted for my credentials and I provided my domain logon, but it kept coming back at me until eventually, I got a HTTP 30 Unauthorised error.

A lot of blogs and forum topics online including some at Microsoft (Example: http://blogs.technet.com/b/kevinholman/archive/2008/09/24/installing-the-web-console-on-a-2008-management-server-using-windows-authentication.aspx) will recommend that you configure Kerberos Delegation for the computer account which hosts the Web Console, using the credentials of the SCOM SDK Service Account.

This is my eyes was a bit of a dirty hack, and the cleanest and most obvious solution had to lie in IIS and its Authentication schemas.

image

Sure as could be, the OPWebConsoleApp Application Pool in IIS was configured with ApplicationPoolIdentity which in English means it’s not no permissions on the network, or has no access to the domain to verify domain credentials.

My solution to the problem is as follows.

Firstly, create a new Application Pool in IIS. Call it what you like, but this will be hosting your Operations Manager Web Console, so best to name it accordingly. I named mine SCOM 2007 R2 Web Console. I also elected not to have the Application Pool start immediately, as we need to configure the credentials on the Pool first.

image

Right-click on the new Pool, and select Advanced Settings. Under the Process Model group, there is an item called Identity – Click the … button on the right of the line to open the next dialog. Change the Identity to Custom Account and specify the username and password for a domain service account which can host the Pool, then click OK button you get back to the Application Pools list in IIS.

Now you can start the Pool by right-clicking and select Start. If the Pool fails to start, you need to verify that your credentials specified for the Pool were correct, and that you don’t have a Group Policy preventing that account from running as a service or such.

Now, right-click on the existing OPWebConsoleApp Applications Pool and select View Applications.

image

Right-click on each of the applications, and select the Change Application Pool option. You will be given a list of available Pools, and select the one which you just created.

Once complete, you need to restart Web Sites, however the easiest thing to do, is from an elevated command prompt type iisreset which will reset all of the Pools and Web Sites.

Assuming you have Windows Authentication enabled on the Operating Manager 2007 WebConsole Web Site (which you should by default) then you should now be able to successfully access the site using Single-Sign On (SSO) with no requirement to enter credentials.

For bonus points, you can be a friendly, security conscious administrator an set the site to Require SSL Encryption and create a new IIS Web Site to redirect Non-SSL users to the SSL site.