management pack

Making SCSM Custom Lists Visible in the Console

This week, I have been working on a custom management pack for System Center Service Manager to add new classes for Mobile Phone and SIM Card Configuration Items. Once of the requirements for this was to include some lists which can be updated via the console and used to store values abut these two CIs.

Creating the properties in each of the new CIs was no problem and setting their Enumeration Type to a list was no problem either but getting the lists to actually display in the Service Manager Console I found rather challenging. I was able to do it using Service Manager Authoring Tool okay but the Authoring Tool seems to make a horrible mess of generating IDs for objects and it uses Aliases for no reason everywhere. I made the switch from the Authoring Tool to Visual Studio Authoring Extensions for System Center 2012 but Visual Studio doesn’t automatically create the code required to make the lists visible.

To fuel the frustration, I was only able to find a helpful solution after many failed online searches, clearly using the wrong keywords. I was only able to find the answer in the end by creating a list in Service Manager in an unsealed management pack, exporting the Management Pack and viewing the XML to reverse engineer it. From the XML I was able to find the name of the proper name for the code value which then turned up a helpful article on TechNet Blogs.

Using Service Manager Authoring Console

If you are attempting to complete this using the Service Manager Authoring Console then you’re on easy street and you don’t need to do anything in the following sections. Simply create your Enumeration List in the custom Configuration Item Class and the list will automagically be made visible for you. If you saw what I saw which is that the Authoring Console makes a right old mess of your management pack and you decide to use Visual Studio with the Authoring Extensions to create your management packs then read on.

Adding the References

In Visual Studio with the Authoring Extensions (VSAE) add two new references to your solution. The references we need to add are  Microsoft.EnterpriseManagement.SerivceManager.UI.Authoring and Microsoft.EnterpriseManagement.ServiceManager.UI.Console. You can find the SCSM 2012 R2 RTM versions of these system management packs in the Service Manager Authoring Console installation directory at C:\Program Files (x86)\Microsoft System Center 2012\Service Manager Authoring\Library. By default these references have Aliases of !MUSEA and !MUSEC respectively but in my project I have changed these to !Authoring and !Console to make them more intuitive for anyone reading the code.

Making the Lists Visible

With our references added, we need to add the code to make the lists visible in the console. You can either add these lines to the Management Pack Fragment which contains your list definitions (which I have done) or you may wish to have a separate Management Pack Fragment for elements which you are publishing into the UI. Either way, they will be included in the compiled project it’s just your choice about how you structure your project and the code for development.

<Categories>
   <Category ID="Class.List" Target="Class.EnumerationTarget" Value="Authoring!Microsoft.EnterpriseManagement.ServiceManager.UI.Authoring.EnumerationViewTasks" />
   <Category ID="Class.List.Visible" Target="Class.EnumerationTarget" Value="System!VisibleToUser" />
</Categories>

As you can see from the code sample above, we add the Categories section to the fragment and inside that section, we add two Category elements each with unique IDs. The first of the code lines will make the Enumeration List that was declared in the custom Configuration Item class accessible and the second line as you can probably guess from the code makes this visible in the console to end-users.

Unlike most things in Service Manager management pack development, these two Category IDs appear not to require Language Pack Display Strings to be declared so we’re done here. Save your changes, build the project and import the management pack.

Adding List Items to Sealed Management Packs

If you are developing this management pack for a production system then you should be sealing your management pack for import. If you are providing the end-users with an empty list to which they can add their own custom list items then when the first list item is added, you will need to define an unsealed management pack for the list entries to be stored in. Alternatively, if you want to provide a set of default options, you can include these in the sealed management pack as default options using EnumerationValue as part of your EnumerationTypes. These default options will then be included in the sealed management pack and any new entries added will be stored in the unsealed management pack.

Office 365 Management Pack for SCOM

Yesterday I got a chance to play with the Office 365 Management Pack for SCOM. Usual rules apply, read the release notes, import the Management Pack and then configure it, the same rules for all Management Packs you import into SCOM.

The installation was simple by downloading the .msi file from the Microsoft Download page at http://www.microsoft.com/en-us/download/details.aspx?id=43708 however in that this is a Microsoft Management Pack for a Microsoft product, I would have expected this to be published to the Management Pack Catalog in SCOM not a separate .msi file download as it would have certainly streamlined the installation process a little.

Once installed, the configuration of the Management Pack is really simple as an Office 365 configuration link is added to the Administration view. It gets added to the very bottom of the list so if you think you don’t have it visible, make sure you’ve scrolled all the way to the bottom. From the configuration wizard, you simply feed it a friendly name for your tenant and give it the email address for a user in Office 365 or configured through your Azure Active Directory.

The reason for this post, other than to explain how simple the Management Pack is to deploy is to have a little gripe. The user which you create in Office 365 needs to be configured as a Global Administrator on your tenant. To compare things to on-premises, that’s like using an account which is a member of Enterprise Admins to monitor Exchange On-Premises, a bit of a sledgehammer to crack a nut. I personally like things to be least privileged so the idea of having a Global Administrator account for this purpose is an annoyance. In that the Management Pack is testing the health of services within your tenant, I personally don’t see any reason that this account couldn’t be a Service Administrator to still give it some administrative powers but lessen them or failing that, a standard user. I suspect the need for being an administrator comes from the need to query a service API which is only available to accounts authenticated with administrative rights.

The upside of course to my gripe about the account being a Global Administrator however is that you do not need to assign any Office 365 service licenses to the account so it means you don’t need to shell out £20 a month for your E3 license per user in order to be able to monitor Office 365 from SCOM.

SCOM Hyper-V Management Pack Extensions

If you’ve ever been responsible for the management or monitoring of a Hyper-V virtualization platform, you’ve no doubt wanted and needed to monitor it for performance and capacity. The go to choice for monitoring Hyper-V is System Center Operations Manager (SCOM) and if you are using Virtual Machine Manager (VMM) to manage your Hyper-V environment then you could have and should have configured the PRO Tips integration between SCOM and VMM.

With all of this said, both the default SCOM Hyper-V Management Pack and the monitoring improvements that come with the VMM Management Packs and integration are still pretty lacklustre and don’t give you all the information and intelligence you would really like to have.

Luckily for us all, Codeplex comes to the rescue with the Hyper-V Management Pack Extensions. Available for SCOM 2012 and 2012 R2, the Management Pack provides the following (taken from the Codeplex project page):

New features on release 1.0.1.282
Support for Windows Server 2012 R2 hyper-V
Hyper-V Extended Replica Monitoring and Dashboard
Minor code optimizations

Features on release 1.0.1.206
VMs Integration Services Version monitor
Hyper-V Replica Health Monitoring Dashboard and States
SMB Shares I/O latency monitor
VMs Snapshots monitoring
Management Pack Performance improvements

Included features from previous release
Hyper-V Hypervisor Logical processor monitoring
Hyper-V Hypervisor Virtual processor monitoring
Hyper-V Dynamic Memory monitoring
Hyper-V Virtual Networks monitoring
NUMA remote pages monitoring
SLAT enabled processor detection
Hyper-V VHDs monitoring
Physical and Logical Disk monitoring
Host Available Memory monitoring
Stopped and Failed VMs monitoring
Failed Live Migrations monitoring

The requirements to get the Management Pack installed are low which makes implementation really easy. If you keep your core packs updated there is good chance you’ve already got the three required packs installed, Windows OS 6.0.7061.0, Windows Server Hyper-V 6.2.6641.0 and Windows Server Cluster 6.0.7063.0.

The project suggests there is documentation but it seems to be absent so what you will want to know is what is the behaviour going to be upon installation? If you have a development Management Group for SCOM then install it here first to test and verify as you should always be doing. The Management Pack is largely disabled by default which is ideal but there are a couple of rules enabled by default to watch out for so check the rules and change the default state for the two enabled rules to disabled if you desire.

As is the norm with disabled rules in SCOM, create a group which either explicitly or dynamically targets your Hyper-V hosts and override the rules for the group to enable them. The rules are broken down into Windows Server 2012 and Windows Server 2012 R2 sets so you can opt to enable one, the other or both according to the OS version you are using for your Hyper-V deployments.

If you do have the VMM integration with SCOM configured and you are using Hyper-V Dynamic Memory, you will notice very quickly if you enable all the rules in the  Hyper-V Management Pack Extensions that you will start receiving duplicate alerts for memory pressure so make a decision where you want to get your memory pressure alerts from be it the VMM Management Pack or the Hyper-V Extensions Management Pack and override and disable alert generation for the one you don’t want.

There is still one metric missing even from this very thorough Hyper-V Extensions Management Pack and that is the collection of the CPU Wait Time Per Dispatch performance counter, the Hyper-V equivalent of the VMware vSphere CPU Ready counter. I’ll cover this one in a later post with a custom Performance Collection Rule.

You can download the Management Pack from Codeplex at http://hypervmpe2012.codeplex.com/. I hope it finds you well and enjoy your newly found Hyper-V monitoring intelligence.

Configuring the Windows Azure Alerts Preview Feature

As part of the project I’ve been working on for the last six months to deliver a new public website (hint www.primark.com) using Windows Azure we needed to be able to monitor the site performance and alert on warning and critical thresholds for certain counters. At the start of the project, our intention was to use SCOM (System Center Operations Manager) as the cleanest way to get data out of Windows Azure but by the time we went live two weeks’ ago, Microsoft had made available the Windows Azure Alerts feature preview.

Under normal circumstances, SCOM would’ve been a no brainer decision for us as our operational teams use and rely on SCOM already so they are familiar and comfortable using it however with the website, we had a challenge – the third-party.

Setting up SCOM 2007 R2 to monitor Windows Azure sounds really complicated when you read the TechNet article for it at http://technet.microsoft.com/en-us/library/gg276377.aspx however it’s actually pretty simple, something which I’ll cover in a later post on the subject, however as I mentioned, our project involved a third-party development partner who needed to receive the alerts also once we went live. In SCOM, you configure this using an SMTP Subscription to email the alerts raised by the management pack to those who need it, but this would result in our Exchange platform joining the critical path for the monitoring of the website, something which I didn’t want ideally as the architect for the project. Imagine the conversation explaining how you missed a website outage or performance degradation because Exchange was down 😮

Fortunately for me, Microsoft came up trumps with the Windows Azure Alerts preview feature just weeks before I was about to go live with the SCOM management pack configuration for production although I had already configured it for our staging environment by this point.

Windows Azure Alerts allows you to configure SCOM like thresholds and evaluation periods for usage counters and metrics from your Azure services and in turn, generate email alerts for them. This has allowed me to remove Exchange from our critical path for website monitoring because the email alerts are generated directly at source in Windows Azure.

To get started with Windows Azure Alerts, firstly, open your Cloud Service, Web Site, SQL Azure Database or whatever you’d like to monitor in the Windows Azure Management Portal. Once open, select the Monitor tab from the Windows Azure Dashboard.

Azure Cloud Service Monitor

Once you’re on the Monitor tab, select the monitor that you would like to generate alerts for. If the monitor you want to use is not listed then you need to update, amend or possibly even start the configuration of diagnostics. Look at the MSDN page, Collect Logging Data by Using Windows Azure Diagnostics to get started.

Azure Cloud Service Add Rule

With the monitor highlighted, the contextual bottom navigation now shows an option Add Rule. Click this to open the rule definition wizard.

Azure Alert Define Rule

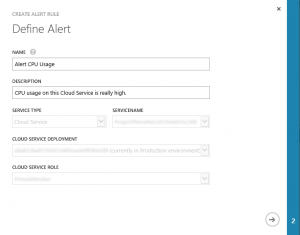
In this rule, I’m configuring monitoring for high CPU utilization on a Cloud Service. Give the rule a name and a description. These are included in the email alert you are sent in the event that the rule is triggered so make sure that it’s something you or people receiving the alert can relate to. Once entered, click the arrow to go to page two.

Azure Alert Define Conditions

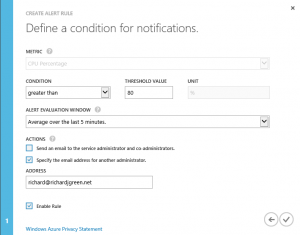
On page two as shown above, you configure the conditions for the rule. In the case of CPU usage, I’m going to monitor on CPU usage over 80%. Rules are evaluated over a time period before they breach. This is ideal for CPU and memory counters as it means that you won’t be alerted for momentary peaks in demand due to activity occurring in the service but will be alerted for sustained period of high draw. Here, I am setting the evaluation period to the default option of five minutes.

Under the sub-heading Actions, you define whether a single email address (which could be a distribution list) or all of your Azure administrators and co-administrators receive the email alert from the rule. As we have a number of people such as project deployment engineers and developers accessing Azure and the only people who need to receive the alerts are the operational teams, I elected to enter an email address for a distribution list and not all of the subscription administrators and co-administrators.

The last option is the tick box to enable the rule which is checked by default. Click the success tick button to complete the two step wizard and the rule will be created.

Azure Management Services View Alerts

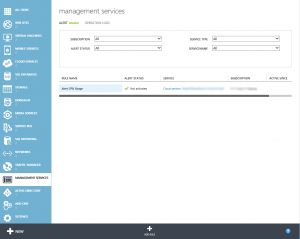
Switching context to the Management Services pane in Azure allows you to see a list of all of the alerts configured for the subscription be they for Web Sites, Cloud Services, SQL Azure Databases or more. Here, I only have one configured but in our production subscription we currently have 10.

There is currently an imposed limit of 10 alert rules per subscription while the feature is in preview. I’ve been meaning to call Microsoft Azure PSS (Premier Support Services) for a week now to see if we can get this limit raised as we would like to create a few additional rules but I haven’t got round to it yet. If I manage to do this, I’ll be sure to let you all know.

So there you have it. How to create email alerts for performance thresholds as you would do with SCOM, directly in Windows Azure removing the need to configure an extra management pack in your SCOM environment and removing critical path dependencies from your internal systems to receive alerts for Windows Azure services. I’m looking forward to this feature coming out of preview and into production service hopefully with a few extra bells and whistles.